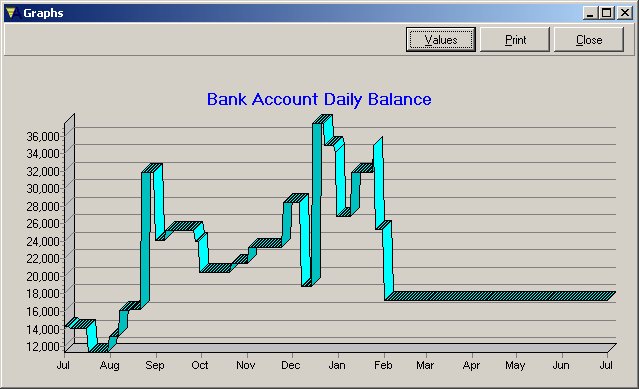
The Bank Balance graph, as the name suggests, plots your bank account balance over the entire financial year. You can elect to included one, several or all your bank accounts. You can also nominate a heading for the graph, but if you leave it blank, CashManager will choose an appropriate heading for you.
Once the graph has displayed, you have the option of printing it - simply click Print.
You also have the option of displaying in table format the actual values used by CashManager to build the graph (click Values).